ePoster 4831| AACR 2020
Streck Research and Development, La Vista, NE
Stability of Draw Time microRNA Concentration in RNA Complete BCT™
Eunju Seong, Ph.D., and Nicholas George, Ph.D.
For Research Use Only. Not for use in diagnostic procedures in the U.S.
Abstract
The microRNA (miRNA) family, which is one of the most abundant extracellular RNA classes in blood, has drawn attention for its potential diagnostic and prognostic values in a variety of disease conditions. However, a substantial portion of the miRNA has significant person-to-person variability even within healthy populations [1], and preanalytical processing of blood samples can introduce even larger technical variability. Plasma miRNAs are particularly sensitive to blood collection tube type and blood storage and processing conditions [2]. Upon blood draw, the plasma miRNome undergoes ex vivo changes in concentration and in composition, mostly due to blood cell breakdown. In this study comparing EDTA and Streck RNA Complete BCT™ (RNAC), we performed RNA extraction of whole plasma and of plasma extracellular vesicles (EV) from blood samples stored over a 7-day period at ambient temperature. For each RNA sample, total miRNA concentration was determined by a fluorometric assay and a set of 12 specific miRNAs were quantitated by Real-Time PCR (RT-PCR) analysis. While EDTA samples display evident increases in total miRNA amount and in individual miRNA quantities, Streck RNAC minimizes ex vivo changes of blood samples and maintains draw time concentration of plasma miRNAs. These data demonstrate that Streck RNAC provides enhanced control over preanalytical variability in plasma sample processing for downstream miRNA assays.
Materials & Methods
Plasma Sample Preparation: From 6 healthy donors, blood was collected into 5 EDTA and 5 Streck RNAC tubes. Plasma was isolated from a pair of each tube type at 5 time points—draw time (Day 0) and 1-7 days post blood draw (Day 1, 2, 4, and 7)—by a double-spin protocol (1800 g, 15 min and 2800 g, 15 min) and aliquoted in 1 mL volume before freezing at -80 °C.
RNA Extraction: For each plasma sample, RNA was extracted by two different methods: 1) RNA extraction from whole plasma using Plasma/Serum Circulating RNA Purification Mini Kit, Slurry (Norgen, Cat.# 51000). 2) RNA extraction preceded by EV isolation using Qiagen exoRNeasy Midi Kit (Qiagen, Cat.# 77144) and modified to incorporate additional Proteinase K digestion at 60 °C. In both procedures, a mixture of 3 RNA spike-ins (Qiagen, Cat.# 339390) was added during lysis.
miRNA Quantitation: Purified RNA was fluorometrically quantitated for miRNA content using Qubit microRNA assay kit (Invitrogen, Cat.# Q32880).
miRNA Reverse Transcription (RT) and Quantitative PCR Analysis: 1 ng of miRNA was reverse transcribed using miRCURY LNA RT Kit (Qiagen, Cat.# 339340) with additional spike-in RNA. For each sample, 5 RNA spike-in PCRs were run in duplicate to verify extraction and RT efficiency. Twelve specific miRNAs including let-7a-5p and miR-142-3p, which are enriched in EV [3], were assessed using miRCURY LNA miRNA PCR Assays (Qiagen, Cat.# 339306). miRNA PCRs were run in triplicate in Applied Biosytems 7500 Fast Dx Real-Time PCR instrument with interplate calibrator assay added to each plate for multi-plate comparison. PCR run files were uploaded on to ThermoFisher Cloud and processed using Applied Biosystems Relative Quantitation Analysis Module. Two of the extraction spike-ins were used as exogenous normalizers to obtain Cq (quantification cycle) values. One sample (EDTA, Day 0) from the whole plasma RNA set was excluded due to unusually low RT efficiency. The number of samples for each PCR assay is 5 and 6 for the whole plasma and the EV-derived RNA, respectively.
Results
Plasma miRNA Maintained at Draw Time Level in Streck RNAC Tube
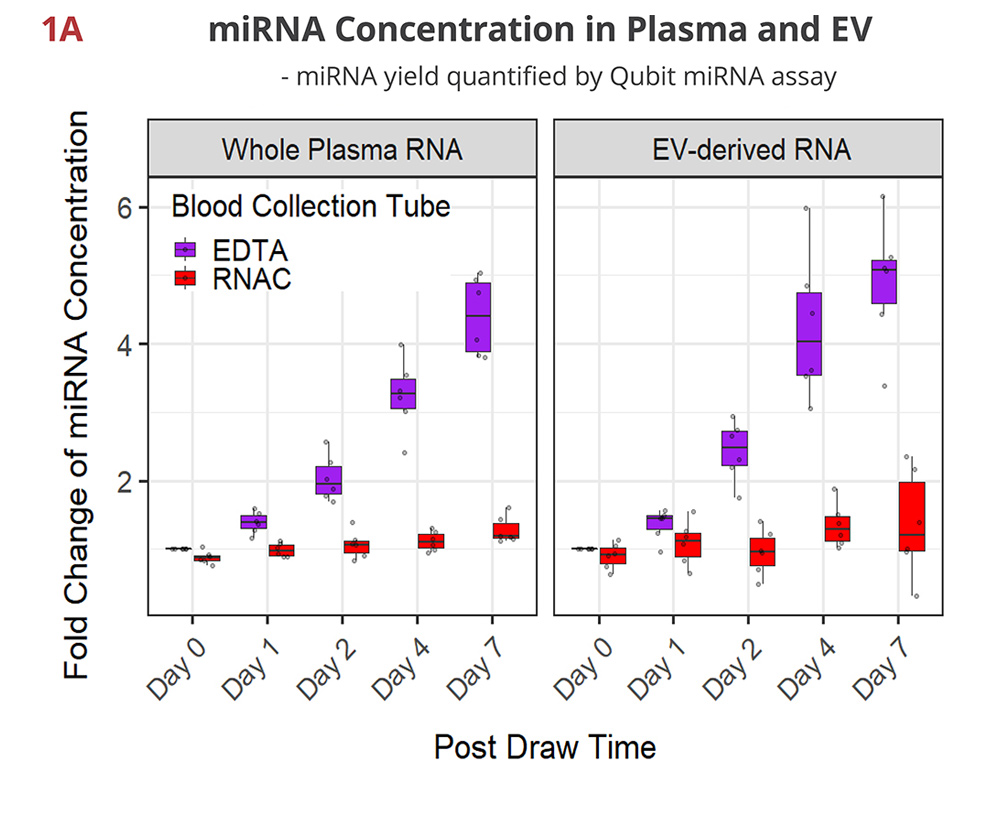
Fig 1A. miRNA concentration maintained in RNAC
In EDTA tubes, miRNA concentration continues to rise over time as blood cells break down and release cellular RNA into plasma. Both whole plasma- and EV-derived RNA samples show similar steady increases in quantity that reach up to 4-5 fold on Day 7. In contrast, Streck RNAC shows the miRNA is well-maintained at draw time concentrations.
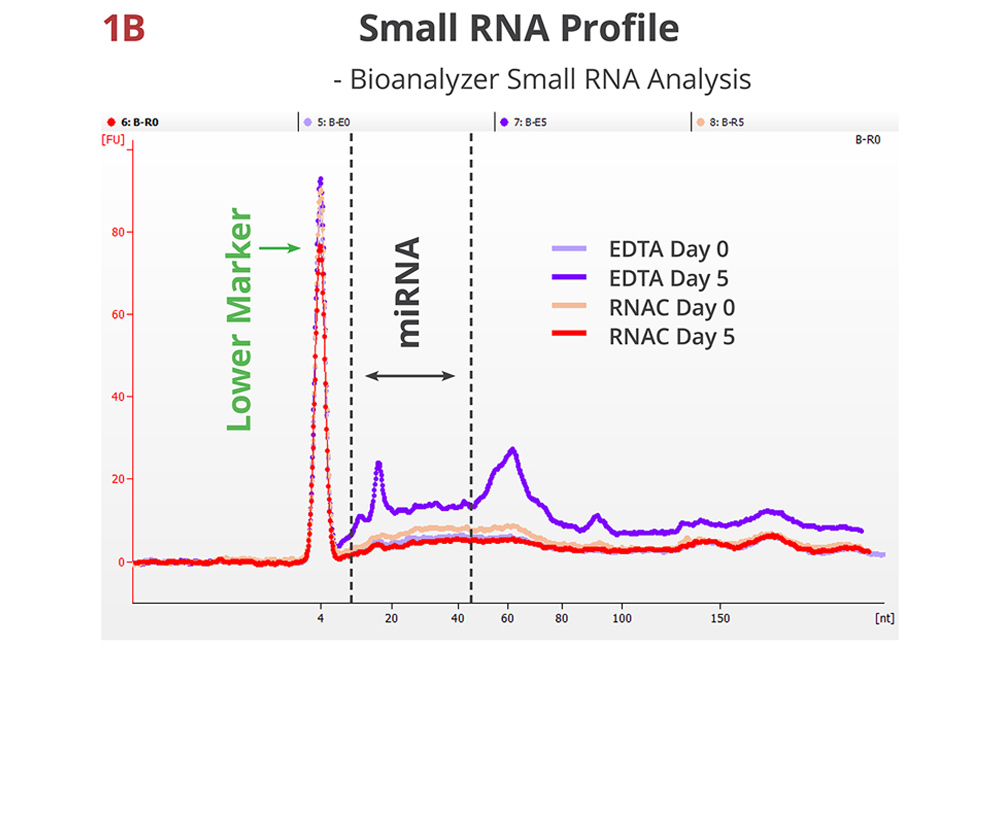
Fig 1B. Small RNA profile maintained in RNAC
A representative electropherogram of whole plasma RNA samples. In addition to the global increase of total RNA, the stored EDTA sample displays new peaks that may correspond to distinct small RNA classes, e.g., miRNA and tRNA. The stored RNAC sample shows very similar distribution pattern as the draw time samples.
miRNA Enrichment/Depletion in EV Distorted Over Time in EDTA Tube
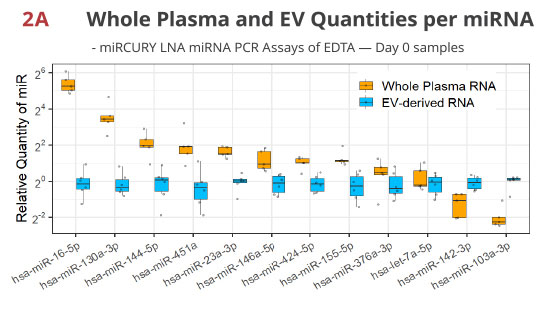
Fig 2A. miRNA RT-PCR of whole plasma- or EV-derived RNA validates miRNA enrichment / depletion in EV in EDTA tube
The Norgen kit extracts RNA from whole plasma and included the EV population while the Qiagen kit first isolates EV through a spin column, thus depleting extravesicular miRNAs. As expected, the quantities of the extravesicular miRNAs like miR-16-5p [3] are higher in whole plasma, while the EV-enriched let-7a-5p is similar between these two extractions. A rather unexpected finding is that miR-142-3p and miR-103a-3p are much lower in whole plasma RNA, which may indicate unequal extraction or PCR efficiencies of these two methods for a subset of the miRNA.
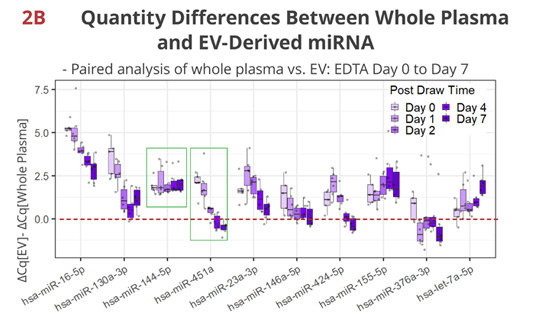
Fig 2B. Timewise loss of the unique enrichment/depletion in EV per miRNA
In EDTA tubes, other than miR-144-5p, most miRNAs display various changes in the proportion of RNA quantities associated with EV. For example, miR-451a, a hemolysis marker for serum [2], is initially more abundant in whole plasma than in EV, but rapidly loses the extravesicular enrichment. By Day 2, its quantity is similar between whole plasma and EV, indicating that newly formed EV from disintegrating red blood cells account for the majority of miR-451a at this point.
Individual miRNAs Stably Maintained in Streck RNAC Tube
RT-PCR Analysis of Individual miRNA Stability Over Time: EDTA vs. RNAC
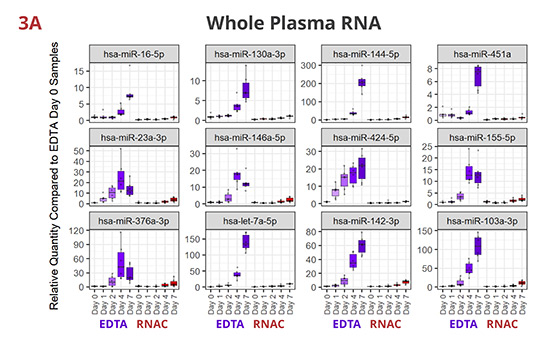
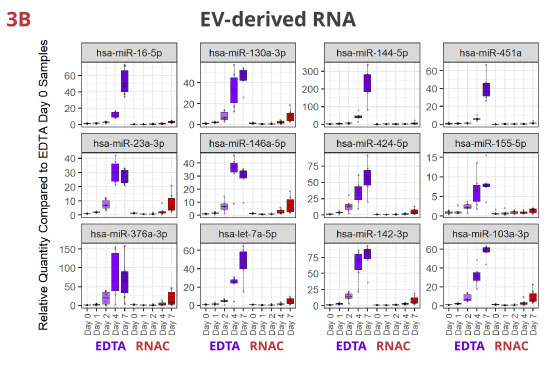
Fig 3. Individual miRNAs variably increased in EDTA but maintained steady in RNAC
In EDTA tube, miRNAs dynamically increase in various patterns—linear or exponential increments, or initial increase followed by a plateau or a decrease. Although per miRNA, the pattern of increase is roughly consistent between whole plasma (3A) and EV-derived (3B) RNA samples, the maximum Rq (relative quantity) differs more noticeably (compare Y-axis scales). On the contrary, in Streck RNAC tube, most miRNAs are maintained at draw time level up to four days. On Day 7, deviations are detectable for some miRNAs, especially in EV-derived RNA samples.
miRNA Preanalytical Variability Minimized in Streck RNAC Tube
miRNA Quantity Distribution in Blood Samples from the 7-Day Period
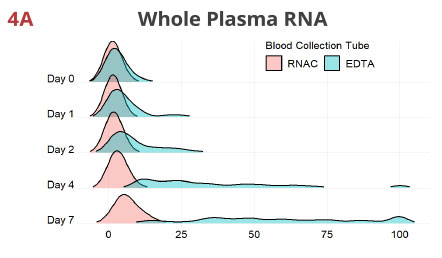

Fig 4. RNAC minimizes ex vivo drift of miRNAs into plasma from blood cells
For each miRNA, values are rescaled as percentiles of the maximum Rq detected in the entire data set per extraction method. The Rq percentiles (X-axis), comparable across all 12 miRNAs, are used to generate density plots, with EDTA and RNAC being overlaid. These graphs suggest in EDTA tubes, the miRNome deviates noticeably even at 24 hrs after blood draw and the most conspicuous drift occurs between Day 2 and Day 4. In contrast, Streck RNAC maintains the draw time miRNA quantity distribution tightly up to Day 4. Although Day 7 samples display moderate deviation, they show improvement when compared to EDTA Day 2 samples (compare the width of each curve).
Conclusions
- In blood drawn into EDTA tubes, the plasma miRNome continues to increase in overall quantity and undergoes compositional changes during sample storage.
- In EDTA tubes, plasma miRNAs originally EV-enriched or extravesicular become intermixed over time during storage.
- Streck RNA Complete BCT maintains draw time concentration of miRNA biomarkers when stored for up to 7 days at room temperature by minimizing ex vivo drift in the plasma miRNome.
References
- Keller A et al., Sources to Variability in Circulating Human miRNA Signatures. RNA Biol. 2017 Dec 2;14(12):1791-1798.
- Murray MJ et al., “Future-Proofing” Blood Processing for Measurement of Circulating miRNAs in Samples from Biobanks and Prospective Clinical Trials. Cancer Epidemiol Biomarkers Prev. 2018 Feb;27(2):208-218.
- Arroyo JD et al., Argonaute2 complexes carry a population of circulating microRNAs independent of vesicles in human plasma. Proc. Natl. Acad. Sci. 2011; 108(12): 5003-5008.