STATS® ILQC Program


Our STATS ILQC program is an effective way for you to demonstrate compliance with quality control practices by evaluating the performance of your instrument or method against a peer group comprised of other labs using the same instrument, method and control lot number. Laboratories who participate in the STATS program will receive personalized, easy-to-read reports to monitor changes in their systems before they significantly impact patient results. Our online program, STATS-Link®, is an enhanced data access portal that allows labs to submit data online, view real-time reports, retrieve monthly reports and manage the lab’s STATS account information.
STATS is available to all customers and is always free of charge. To enroll in STATS, click here.
Questions or enrollment for Abbott U.S. customers: please call 1-877-4-Abbott. For laboratories outside of the U.S., please contact your local customer support center for more information.
Frequently asked questions
General
Click here. Select “Create a Login” and follow the onscreen prompts. Enrollments are processed within 2 business days.
Linearity data is processed weekly. All other control data is processed monthly. See the Due Date Schedule for specific product due dates.
Click here. Select “Forgot password?” Enter the email address for your login, then click the “Send Reset Email” button. Follow the instructions provided in the email.
STATS-Link can be used with IE11, Microsoft Edge, Google Chrome, and Firefox.
Peer group data can vary from product to product, instrument to instrument and month to month.
Please contact us at [email protected] or 800-898-9563 so we can discuss your instrument needs.
Data submission
Data can be submitted via STATS-Link by manually entering data, uploading your instrument output file or importing your data in our Excel input forms.
Exclusion limits are two times the published assay range for each parameter and instrument. Data submitted to STATS-Link that is outside of the Exclusion limits will be flagged in aqua highlight and will not be included in data calculations. If daily data is submitted, any values that are determined to be outliers will be listed with a horizontal strike-through (e.g., 0.00) in the Data Submission section on the monthly report. (Prior to December 2020, these limits were listed as Low and High Limits.)
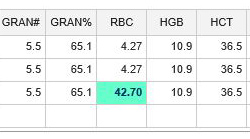
A value will be highlighted in aqua when it exceeds the Exclusion Limits, which are calculated as two times the published assay range for each parameter. For example, an RBC value that is entered as 42.70 is highlighted in aqua as it exceeds the Exclusion Limit High of 5.07. This flag should prompt a review of the data during the data submission process. In this case, the data was mistyped as 42.7 instead of 4.27. Data that exceeds the Exclusion Limits will not be included in the data calculations.
Assay ranges in the chart are the published ranges listed for each product assay and are specific to each parameter, level and instrument. When a lab’s mean or SD for a parameter falls outside of the published assay range, the entire parameter column will turn purple to indicate the data should be reviewed for accuracy. Data that is flagged purple will remain part of the overall lab and group calculations.
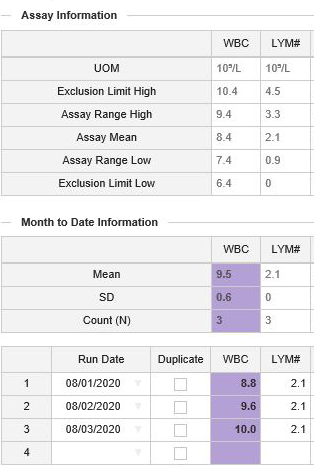
A parameter column will be highlighted in purple when a lab’s calculated mean falls outside of the published assay range or when a lab’s standard deviation (SD) for a parameter exceeds the published assay range. For example, if data entered on Day 1 and 2 for the WBC parameter is 8.8 and 9.6, respectively, one data point is within the assay range, and one is high/out of the assay range. However, the overall mean of 9.2 is still within the assay range (7.4 – 9.4). The addition of WBC value of 10.0 for Day 3 would result in a calculated mean of 9.5, which is high/out of the assay range. This high calculated mean would trigger a flag for the WBC parameter and suggests that the data should be reviewed for any anomalies, shifts or trends.
The data submission screen includes two information charts that can be adjusted if needed. Click to Collapse arrow will hide the chart and provide more room on the screen for data entry. Click to Expand arrow will display all the data in the chart to aide in data review. The flagging features will be active at all times, regardless of the screen display selections.
Due Date Schedule
STATS has monthly due dates for all products. Data may be submitted at any time during the month; however, data received after the due date will be held and processed the following month. Data is processed throughout the dating of each lot and will also be processed up to 3 months past the lot’s expiration date.
Input Forms
To download our product specific data submission forms, click here.