
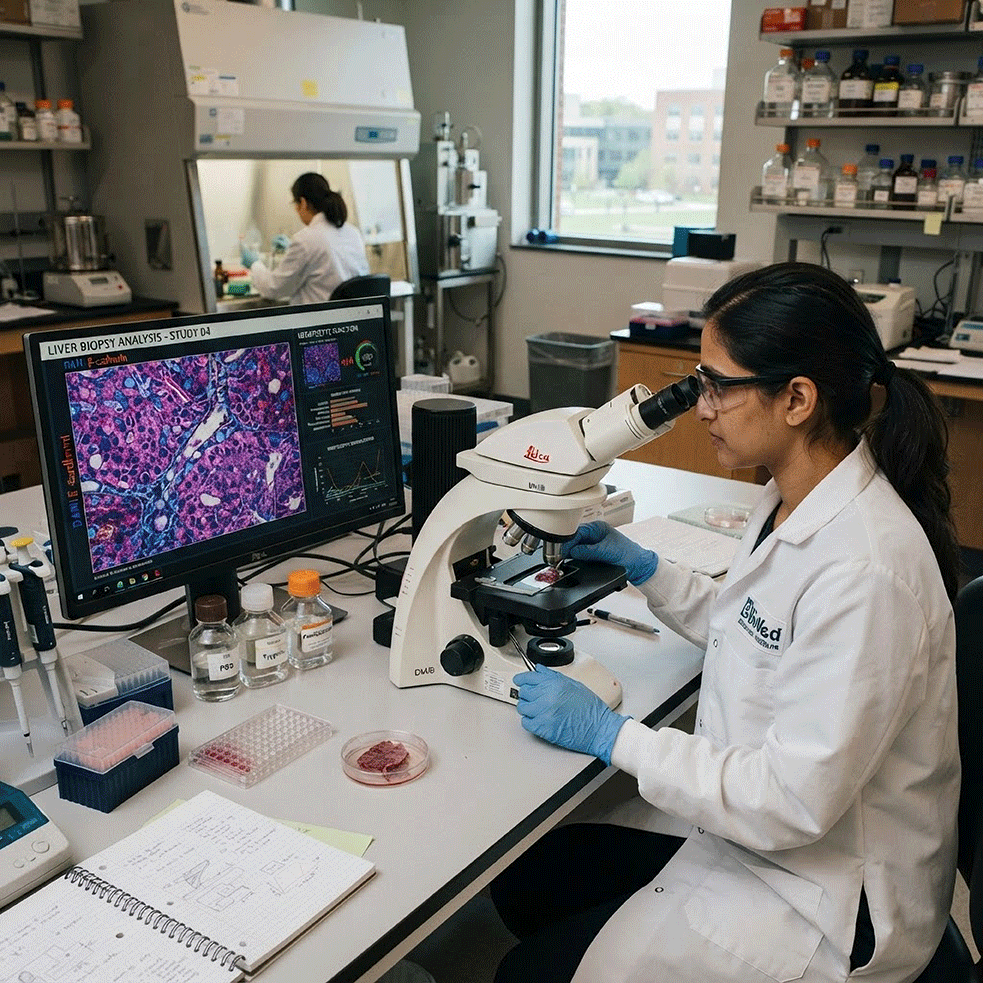
For most of the history of fatty liver disease, staging fibrosis was a prognostic exercise. It told a clinician how worried to be. It did not tell them what to do, because there was nothing approved to do. That is no longer the case. Two therapies are now approved for adults with metabolic dysfunction-associated steatohepatitis and moderate to advanced fibrosis, short of cirrhosis, the first in March 2024 and a second in August 2025. Both arrived through accelerated approval on histologic surrogate endpoints rather than on demonstrated reductions in cirrhosis, hospitalization or mortality, and confirmatory trials remain underway. Even with that caveat, the practical consequence is immediate: fibrosis stage is now attached to a prescribing decision.
Briefly, for readers who work in molecular methods rather than hepatology. MASLD is fat in the liver in the presence of cardiometabolic risk factors. MASH is the subset that adds inflammation and hepatocellular injury. Fibrosis stage describes the scarring that accumulates as a result. The approved indications sit at moderate to advanced fibrosis without cirrhosis, which is a narrow slice of a very large denominator.
The denominator is large. Cross-sectional NHANES data from 2021 to 2023 put MASLD at roughly 32.5 percent of US adults. A separate microsimulation model estimated approximately 14.9 million U.S. adults with MASH as of 2020. Neither figure is the prevalence of biopsy-defined MASH with moderate to advanced fibrosis, which is smaller and considerably less well established. The point is not the exact number. It is that a small fraction of a population that size is still a great many people to find.
Finding them is the problem. Society guidance describes a sequenced assessment rather than a fixed algorithm: a simple blood-based risk score first, calculated from routine laboratory values; then elastography or another validated secondary test in appropriate patients; then biopsy reserved for indeterminate or discordant cases, with clinical judgment at each step. Neither drug label mandates biopsy or any specific non-invasive test.
That guidance was largely derived in referral populations, and published performance in broader ones has been more variable. One general-population analysis reported substantial discordance between the first-line index and elastography, including participants classified as low risk who had elevated liver stiffness; those participants skewed older and heavier, with higher waist circumference and glycohemoglobin. Separate work reported specificity falling with age at standard thresholds, to a level the authors characterized as unacceptably low in adults over 65. The failure modes track test, threshold, age, body mass index and background prevalence rather than any single patient characteristic, which makes them difficult to correct with one adjustment.
Biopsy does not scale. Specialized imaging is not evenly distributed. The pressure lands on blood.
What is actually moving into that gap is protein. The most widely used first-line tool is not a proprietary product at all, but an index computed from routine laboratory values. Behind it sit composite protein and biochemical panels: the guideline-referenced three-analyte fibrosis panel built on hyaluronic acid, a type III procollagen peptide and a tissue inhibitor of metalloproteinases; panels combining macroglobulin, HbA1c, YKL-40 and a microRNA; collagen-fragment neoepitope markers; and broader multiplex proteomic panels. Metabolomic panels are emerging alongside them.
Cell-free DNA methylation approaches are also being developed in this space, and they are interesting. They are also early. In liver fibrosis specifically they sit behind protein-based measurement both commercially and in the guidelines, and anyone building here should be clear-eyed about that ordering.
Which raises a question that is easy to skip while a panel is being designed: what happened to the sample between the draw and the lab?
A composite score is a calculation across several measured analytes, and its inputs do not all behave the same way. In published interference work on the three-analyte fibrosis panel, the procollagen component fell measurably in the presence of free hemoglobin, roughly a 10 percent drop at 0.5 g/L, which is a modest degree of hemolysis. In related work the metalloproteinase-inhibitor component fluctuated substantially once centrifugation was delayed by four hours. The same studies found the analytes read differently in serum than in lithium-heparin plasma, one component measuring about 23 percent higher in plasma and another nearly 40 percent lower.
None of that is an analyte-degradation story in the abstract. Free hemoglobin tells you that red cell contents are in the specimen. It does not tell you when or how they got there. Hemolysis can occur in vivo, at the draw, or during transport and processing, and both of these studies produced it deliberately rather than observing it arise. Delay before centrifugation means whole blood, cells included, sat there. The pre-analytical variable being described is the condition of the blood cells in the tube.
Now the part that has to be said plainly, because leaving it out would be the quickest way to lose a reader who knows this literature. The composite score held up better than its components. In one of those studies the calculated score moved only about 2 to 4 percent across the hemolysis conditions tested, and bilirubin and lipemia did not move it at all. In the other, the effect of centrifugation delay on the score was negligible even where a component fluctuated. Averaging across three analytes that respond differently to the same insult tends to cancel error.
That robustness is worth describing for what it is: an empirical result at the interference levels tested, not a designed safeguard. The panel as studied carries no hemolysis index and no platelet-activation marker, so a laboratory running it has no built-in flag indicating when a sample sat too long or was drawn roughly; the study authors recommended adding one. And the finding applies to that particular three-analyte combination. It says little about a new panel with different components and different weights.
Which is why this matters more to the people building the next panel than to the people running the current one. A team assembling a multi-analyte protein score today selects components on reported discrimination in published studies. Pre-analytical behavior is easy to leave until late in that process. A component that performs well in those studies but is fragile between draw and centrifuge will look fine in a validation study run on samples processed within the hour, and less fine when the same test is deployed for risk-stratified case-finding in primary care and community settings, where that interval stops being a controlled variable.
Stabilized collection addresses this upstream. Stabilizing blood cells in the tube helps limit what they release into the plasma, and therefore what the assay has to contend with downstream. The effect on any given analyte follows from that; it is not a claim about the analyte itself.
Liver fibrosis testing is moving to blood because there is finally something to do with the answer. The tests that are moving are protein panels. And protein panels are exposed to what happens to blood cells between the draw and the lab, unevenly, at the component level, and most of all in the panels that have not been built yet.
If you are scoping a blood-based liver study, our collection tube selector is a starting point on the collection question.
Reading List
1. Harrison SA, et al. A Phase 3, Randomized, Controlled Trial of Resmetirom in NASH with Liver Fibrosis. N Engl J Med. 2024;390(6):497–509. DOI 10.1056/NEJMoa2309000. PMID 38324483. The histologic basis for the first approval. MASH resolution without worsening of fibrosis in 25.9% and 29.9% at the two doses versus 9.7% placebo; fibrosis improvement in 24.2% and 25.9% versus 14.2%.
2. Sanyal AJ, et al. Phase 3 Trial of Semaglutide in Metabolic Dysfunction–Associated Steatohepatitis. N Engl J Med. 2025. DOI 10.1056/NEJMoa2413258. PMID 40305708. Week 72, Part 1 interim analysis behind the second approval. Steatohepatitis resolution without worsening of fibrosis 62.9% versus 34.3%; fibrosis improvement without worsening of steatohepatitis 36.8% versus 22.4%; both endpoints 32.7% versus 16.1%.
3. Chang D, et al. Degree of Discordance Between FIB-4 and Transient Elastography: An Application of Current Guidelines on General Population Cohort. Clin Gastroenterol Hepatol. 2024;22(7):1453–1461. The misclassification evidence in section three. Applies current guideline thresholds to an NHANES general-population cohort; patients misclassified as low risk were older with higher BMI, waist circumference and HbA1c.
4. Kelkka A, Pussinen C, Joutsi-Korhonen L, Pulkki K, Koivula M-K, Lempiäinen A. Preanalytical factors of enhanced liver fibrosis (ELF) laboratory testing: the score is affected by hemolysis. Scand J Clin Lab Invest. 2025;85(5):379–386. DOI 10.1080/00365513.2025.2546316. PMID 40838567. Source for the composite-robustness concession. Hemolysis moved the composite score 2.0% and 4.4%; bilirubin and lipemia did not move it. Serum versus lithium-heparin plasma: PIIINP 23.1% higher and TIMP-1 38.3% lower in plasma. The authors recommend an automated hemolysis index for the test.
5. Bitar, M., Samyn, D., Helgesson, M., Pettersson-Pablo, P., & Vink, M. (2026). Preanalytical effects on the ELF score and its component biomarkers; aminoterminal peptide of type III procollagen (PIIINP), hyaluronic acid (HA) and tissue inhibitor of metalloproteinases-1 (TIMP-1). Scand J Clin Lab Invest. 2026;86(4):374–383. DOI 10.1080/00365513.2026.2679460. Source for the component-level exposure. PIIINP dropped 10% at 0.5 g/L free hemoglobin while HA and TIMP-1 held to 10 g/L; pre-centrifugation delay had minimal effect on PIIINP and HA, but TIMP-1 fluctuated markedly after 4 hours, with negligible net effect on the composite.