
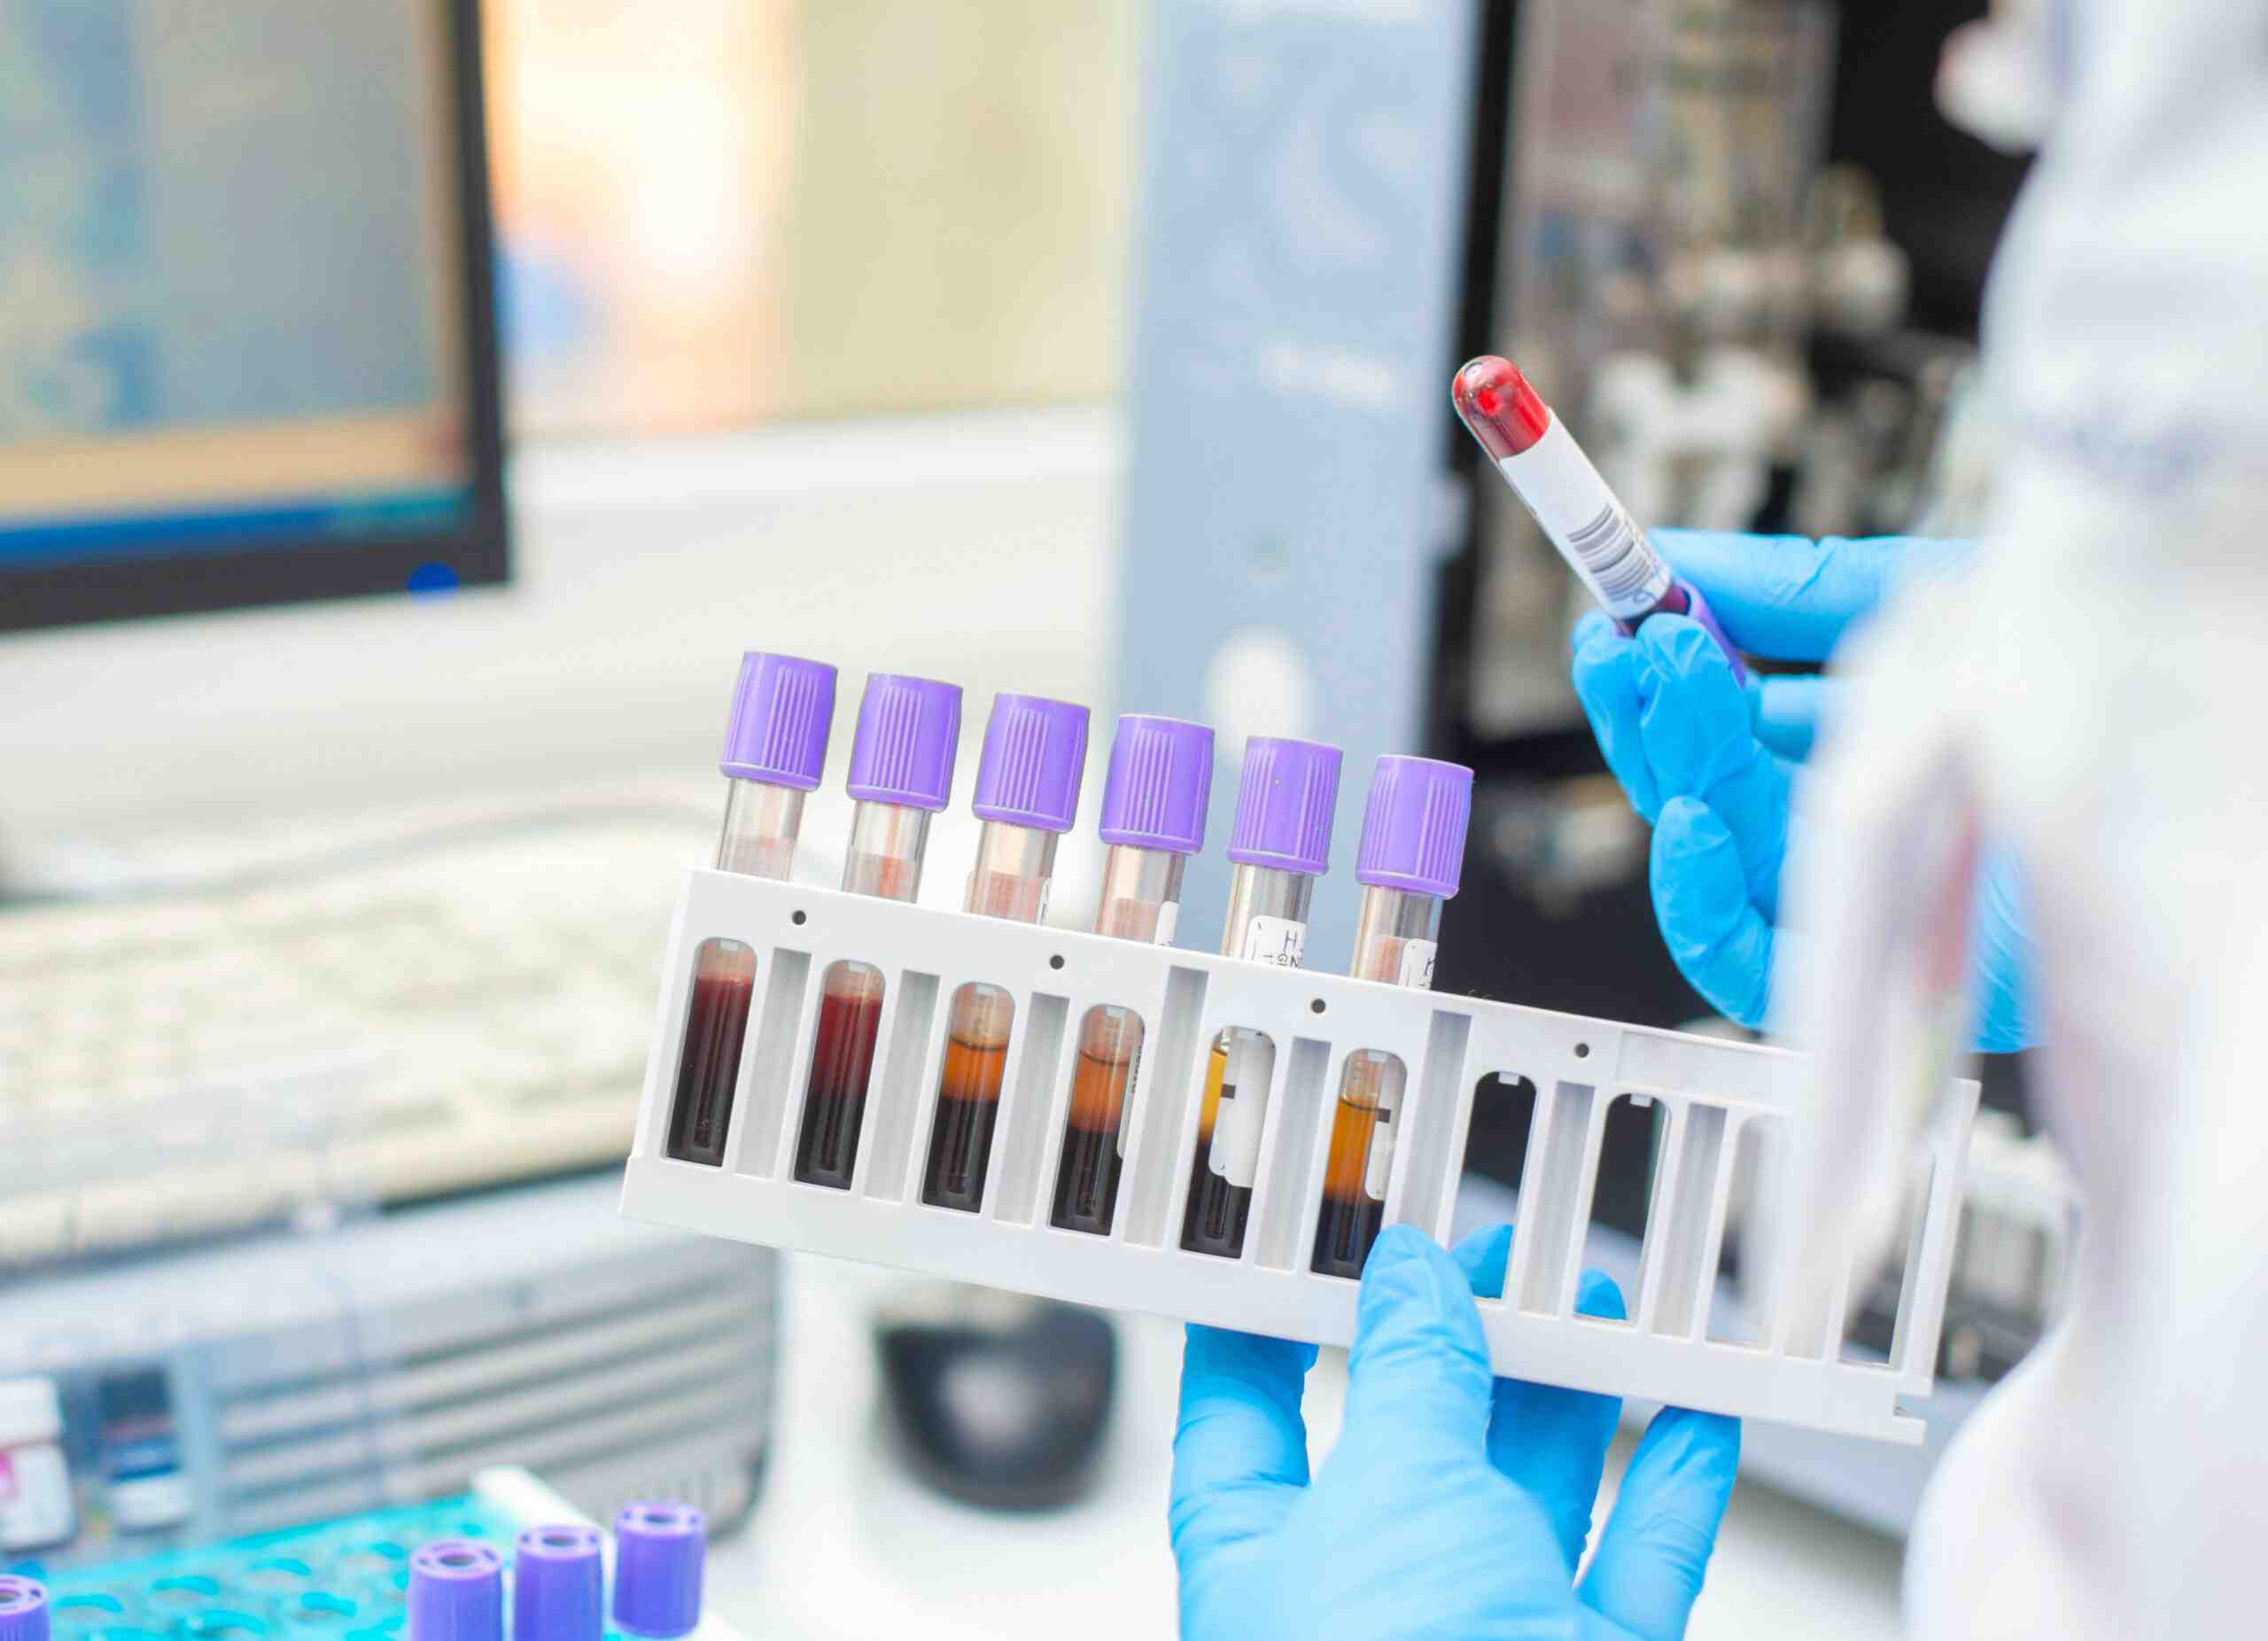
EDTA prevents clotting. That’s what an EDTA tube was built for. It was standardized as a blood anticoagulant in the 1950s, when the goal was keeping cells intact long enough to count them under a microscope, not preserving cell-free DNA in plasma (Banfi, 2007). Liquid biopsy testing didn’t exist yet.
The complication is timing. Samples ship between sites. They sit in a batch queue until there are enough to run together. They wait overnight for a morning courier that hasn’t come yet. None of that involves clotting, and none of it is what EDTA is built to handle.
So what happens if the sample waits? It changes. Some of it within minutes. What’s in the tube when it reaches the instrument is no longer what you drew.
How samples change after the blood draw
As soon as blood is drawn, the clock starts. White blood cells and red blood cells begin breaking down, releasing their intracellular contents into the plasma. As the only nucleated cells in blood, white blood cells release DNA and RNA in addition to proteins and enzymes. Platelets can activate in the tube, even if they weren’t activated at draw, releasing cellular RNA and extracellular vesicles into the plasma. P-selectin (CD62P), a surface marker for activated platelets, shows this clearly: right after the draw, it’s present on about 1% of platelets. Within only three hours in EDTA tubes, that climbs to over 23% (Macey, 2002).
While it’s clear that these changes happen when the sample waits, wait time isn’t often treated as a variable in an experiment, and published methods don’t often report it. Standards bodies have started closing this gap: BloodPAC’s Minimum Technical Data Elements require reporting collection-to-processing time, and ISO-aligned guidance calls for validating that these time windows suit the assay. Still, there is no single length of time when a sample stops representing the draw. That depends on the analyte.
Impacts of blood cell degradation on cell-free DNA assays
Cell-free DNA (cfDNA) assays are where most laboratories first encounter this. When white blood cells become apoptotic, the genomic DNA they release can become the main source of background, making it hard for cfDNA assays to distinguish what DNA was truly “cell-free” at collection versus DNA released into the plasma later.
Even within cfDNA assays themselves, the tolerable window depends on what is being measured. Total cfDNA concentrations and fragment size composition are the first things affected by additional DNA from dying white blood cells. Circulating tumor DNA (ctDNA) and other low-abundance signals are often even more exposed, because their starting fraction is already small. In early-stage cancers, tumor-derived DNA can be less than 0.1% of total cfDNA. Add background to a signal that thin and it drops below what the assay can detect. A high-abundance variant tolerates far more before the measurement moves.
Keeping the cells stable is what protects these results. It’s the foundation everything more sensitive is built on.
More sensitive analytes need quicker processing times
RNA, proteins, and extracellular vesicles are generally considered more sensitive than cfDNA to the gap between draw and processing. Degrading white blood cells can release RNA and RNA-containing vesicles, complicating cell-free RNA (cfRNA) analysis. Platelet activation can add more cfRNA on top of that, especially megakaryocyte-derived RNA, which can skew the detection of cfRNA markers or low-abundance transcripts in whole transcriptome work. Degrading cells can also release active RNA-degrading enzymes. Extracellular vesicle populations and circulating protein marker concentrations shift almost immediately as platelets activate and red blood cells break down, meaning measurements no longer reflect the biological state present at collection.
If even relatively robust analytes such as cfDNA have a limited processing window, more sensitive analytes have even less room for delay.
Degrading samples evade quality checks
Here’s the part that should worry you: the checks built to catch a bad sample are often the same checks a degrading sample can pass.
Genomic DNA released from lysed white blood cells resembles high-quality, amplifiable DNA. A contaminated sample can look like a better sample, with higher DNA concentration, higher library yields and more reads, and still be less representative of the cfDNA fraction at draw time.
Fragment size analysis and the long-to-short fragment ratio can catch this where sequencing metrics can’t. Native cfDNA clusters tightly around a modal peak of about 166 base pairs, well under the length of genomic DNA fragments released from lysed cells (Snyder, 2016). But most quality checks are built to evaluate sequencing performance, not to flag this kind of contamination, so it slips through.
The result: findings may not replicate between laboratories or between runs. For cell-free DNA specifically, the National Cancer Institute’s biospecimen practices put the optimal window at two hours from venipuncture, with a delay of up to four hours at room temperature considered acceptable, and recommend a stabilizing tube when longer delays are anticipated (NCI, 2025).
Evolving collection strategies for modern workflows
EDTA tubes were designed for draw-and-process-immediately workflows. Today’s workflows don’t work that way. Labs outsource. Researchers batch. Multi-site studies collect in one place and analyze in another. In every one of these, the sample waits.
So think about your analyte and your workflow. Are you measuring a readily-detectable mutation or a rare marker? What’s the real gap between draw and processing? If you’re drawing and processing in the same place, EDTA is doing its job. If the gap is bigger, you have options: shrink the gap by keeping things on-site, keep the tube cold for transport, or stabilize the cells in the collection tube so the sample can travel at room temperature.
Reading List
- Macey M, Azam U, McCarthy D, Webb L, Chapman ES, Okrongly D, Zelmanovic D, Newland A. Evaluation of the Anticoagulants EDTA and Citrate, Theophylline, Adenosine, and Dipyridamole (CTAD) for Assessing Platelet Activation on the ADVIA 120 Hematology System. Clin Chem. 2002;48(6):891–899.
- Chan KCA, Yeung SW, Lui WB, Rainer TH, Lo YMD. Effects of Preanalytical Factors on the Molecular Size of Cell-Free DNA in Blood. Clin Chem. 2005;51(4):781–784.
- Zeng W, Liu CC, Li S, Zhou Y, et. al. Toward the Simultaneous Detection of Multiple Diseases with a Highly Cost-Effective Cell-Free DNA Methylome Test. PNAS. 2026.
- Snyder MW, Kircher M, Hill AJ, Daza RM, Shendure J. Cell-free DNA Comprises an In Vivo Nucleosome Footprint that Informs Its Tissues-Of-Origin. Cell. 2016;164(1):57–68.
- Banfi G, Salvagno GL, Lippi G. The Role of Ethylenediamine Tetraacetic Acid (EDTA) as In Vitro Anticoagulant for Diagnostic Purposes. Clin Chem Lab Med. 2007;45(5):565–576.
- BloodPAC. Minimum Technical Data Elements (MTDE). Blood Profiling Atlas for Cancer.
- National Cancer Institute, Biorepositories and Biospecimen Research Branch NCI Biospecimen Evidence-Based Practices: Cell-Free DNA - Biospecimen Collection and Processing. Version 1.0, February 2025.